
GA4 offers a set of default reports that can be customized based on your requirements.
In the evolving landscape of digital analytics, Google Analytics 4 (GA4) stands out with its user-centric and customizable approach. A prominent feature of GA4 is its Report Library, which offers flexibility and structure through Collections and Reports.
Here’s a deeper dive into the features and capabilities of the Report Library in GA4:
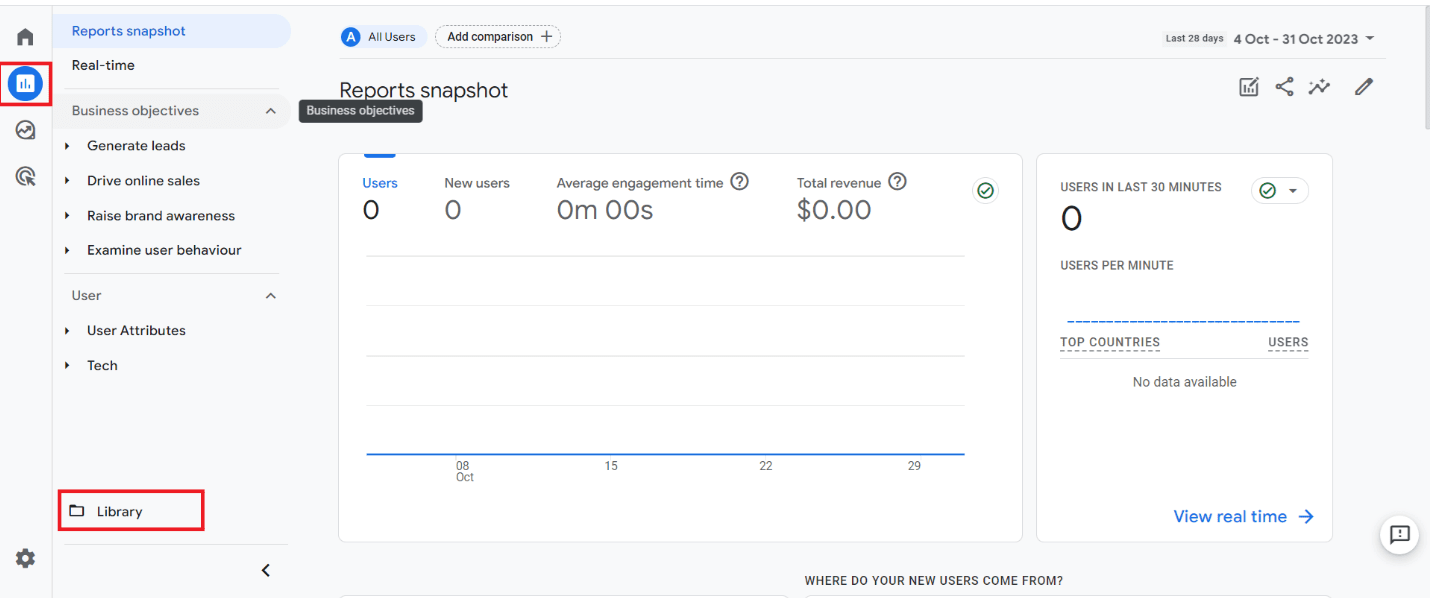
Accessing the Report Library in GA4
To navigate to the Report Library, head over to the Reports section in your GA4 property. Located at the bottom left, this option is available to users with Editor or Administrator access.
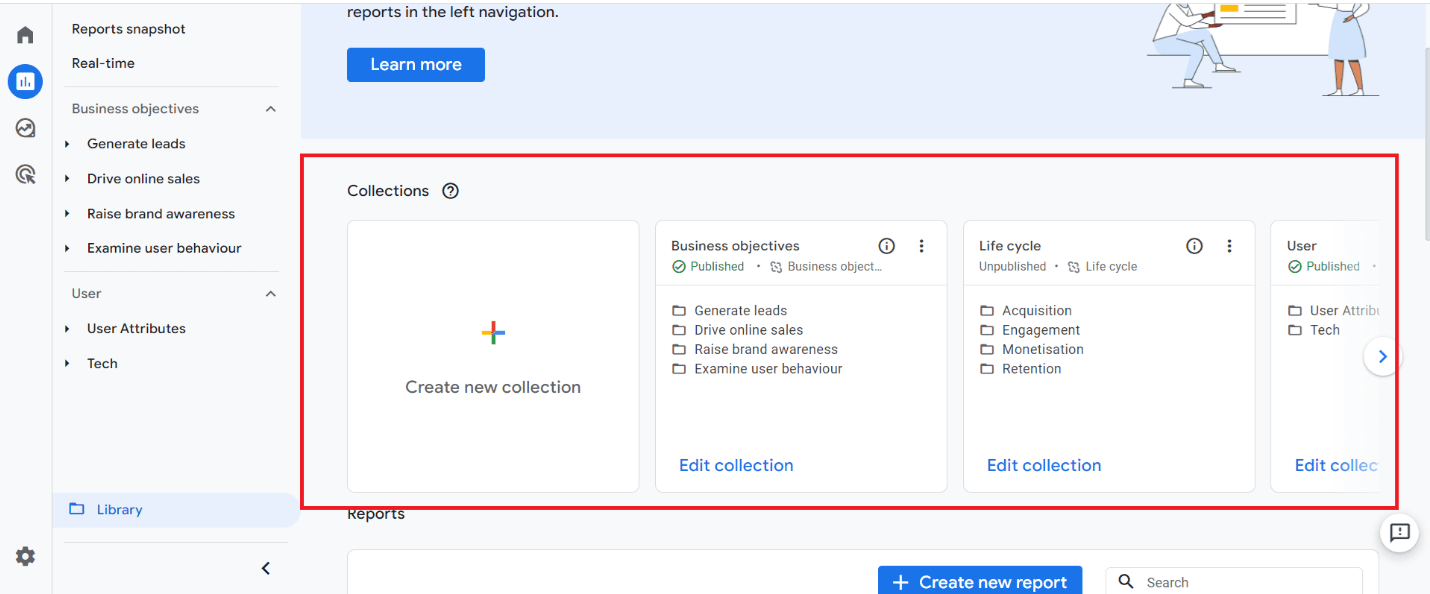
Collections
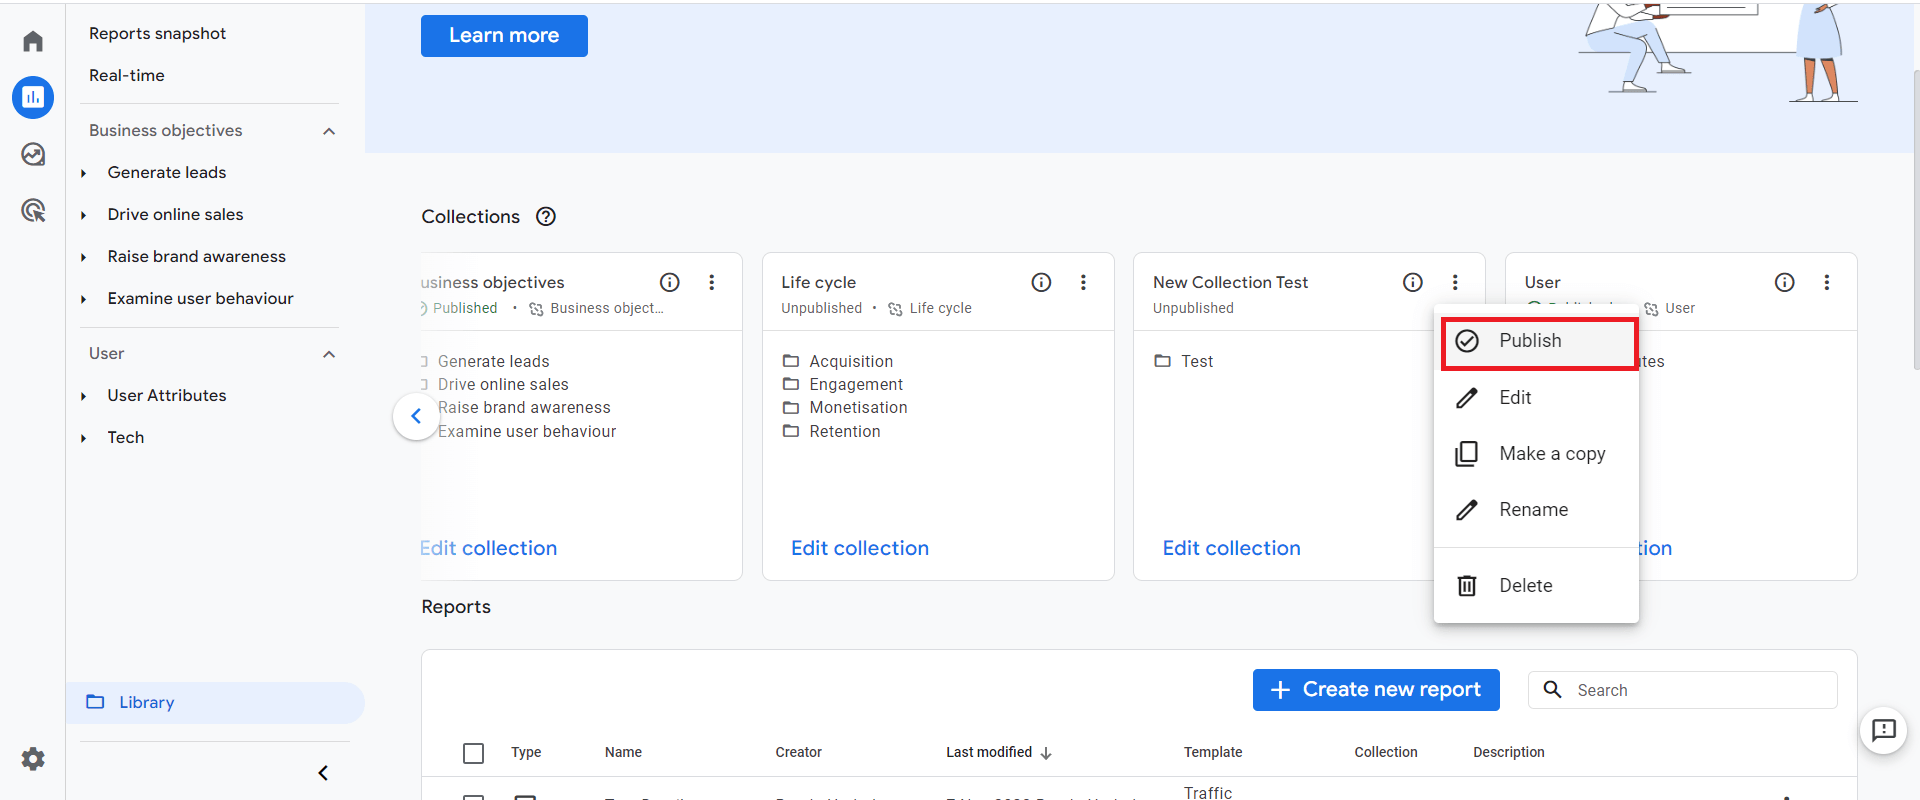
Definition: Collections in GA4 can be thought of as “folders” that group related reports, serving as organizational units within the platform.
Visibility: Collections control which reports appear on the left-hand navigation pane. For instance, if the Life Cycle and User collections are published, only they will show up, ensuring a clutter-free interface.
Purpose: Collections help declutter the Report Library and make navigation more intuitive. By grouping related reports, they provide a streamlined view of different analytical areas.
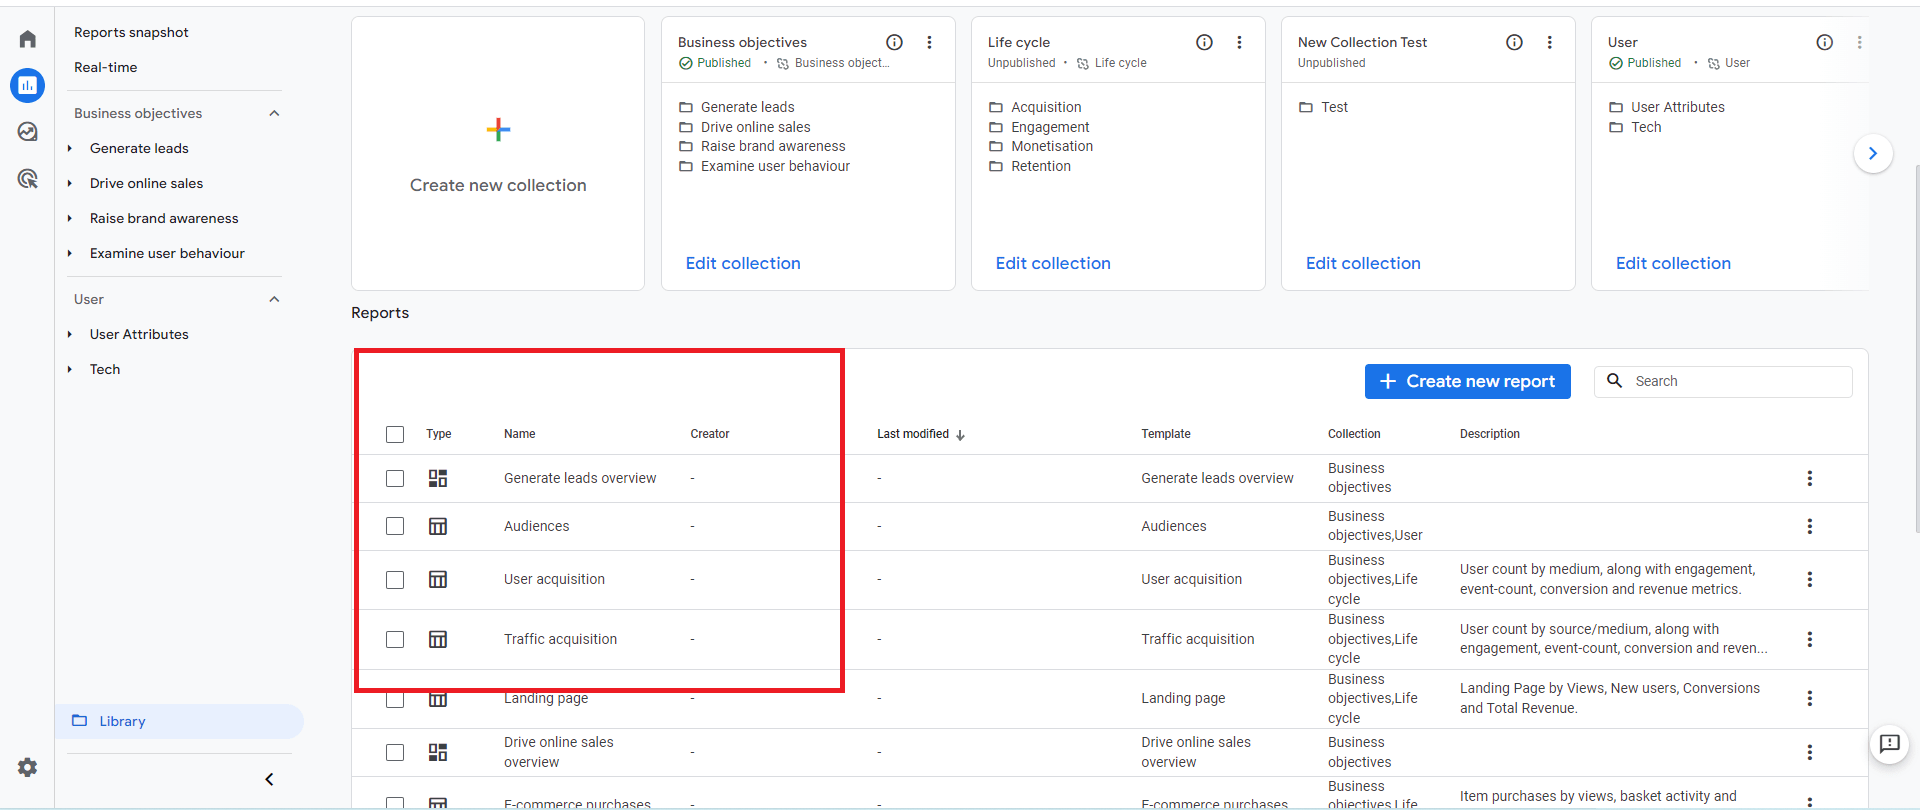
Reports
Definition: Reports are the analytical elements inside collections, presenting data based on selected metrics and dimensions.
Customization: GA4 offers significant customization options:
Pre-made Reports:
Default reports cover a range of analytics needs, which can be further customized.
Overview Reports:
A panoramic window into your data. They:
- Provide a holistic snapshot, illuminating areas like user behavior.
- Use visual charts and graphs for effective representation.
- Allow users to discern patterns or trends swiftly.
- components to manage and share the data in an overview report:
- Date Range: Adjust the timeframe to refine your analysis. This allows users to view data over different periods or even juxtapose two distinct time ranges.
- Quick Help: Some GA4 pages house a ‘Quick Help’ panel. This is your go-to spot for contextual guidance about the particular page or feature you’re navigating.
- Comparisons: Dive deeper by setting up comparisons. For instance, contrast data generated from Android devices with that of iOS devices. Such juxtapositions pave the way for more nuanced insights.
- Share and Export: If you wish to circulate your findings, GA4 allows users to either share a direct link to the report or export it in formats like PDF or CSV.
- Insights: Powered by machine learning and custom-configured conditions, ‘Insights’ serves as a potent tool to interpret and take action on your data.
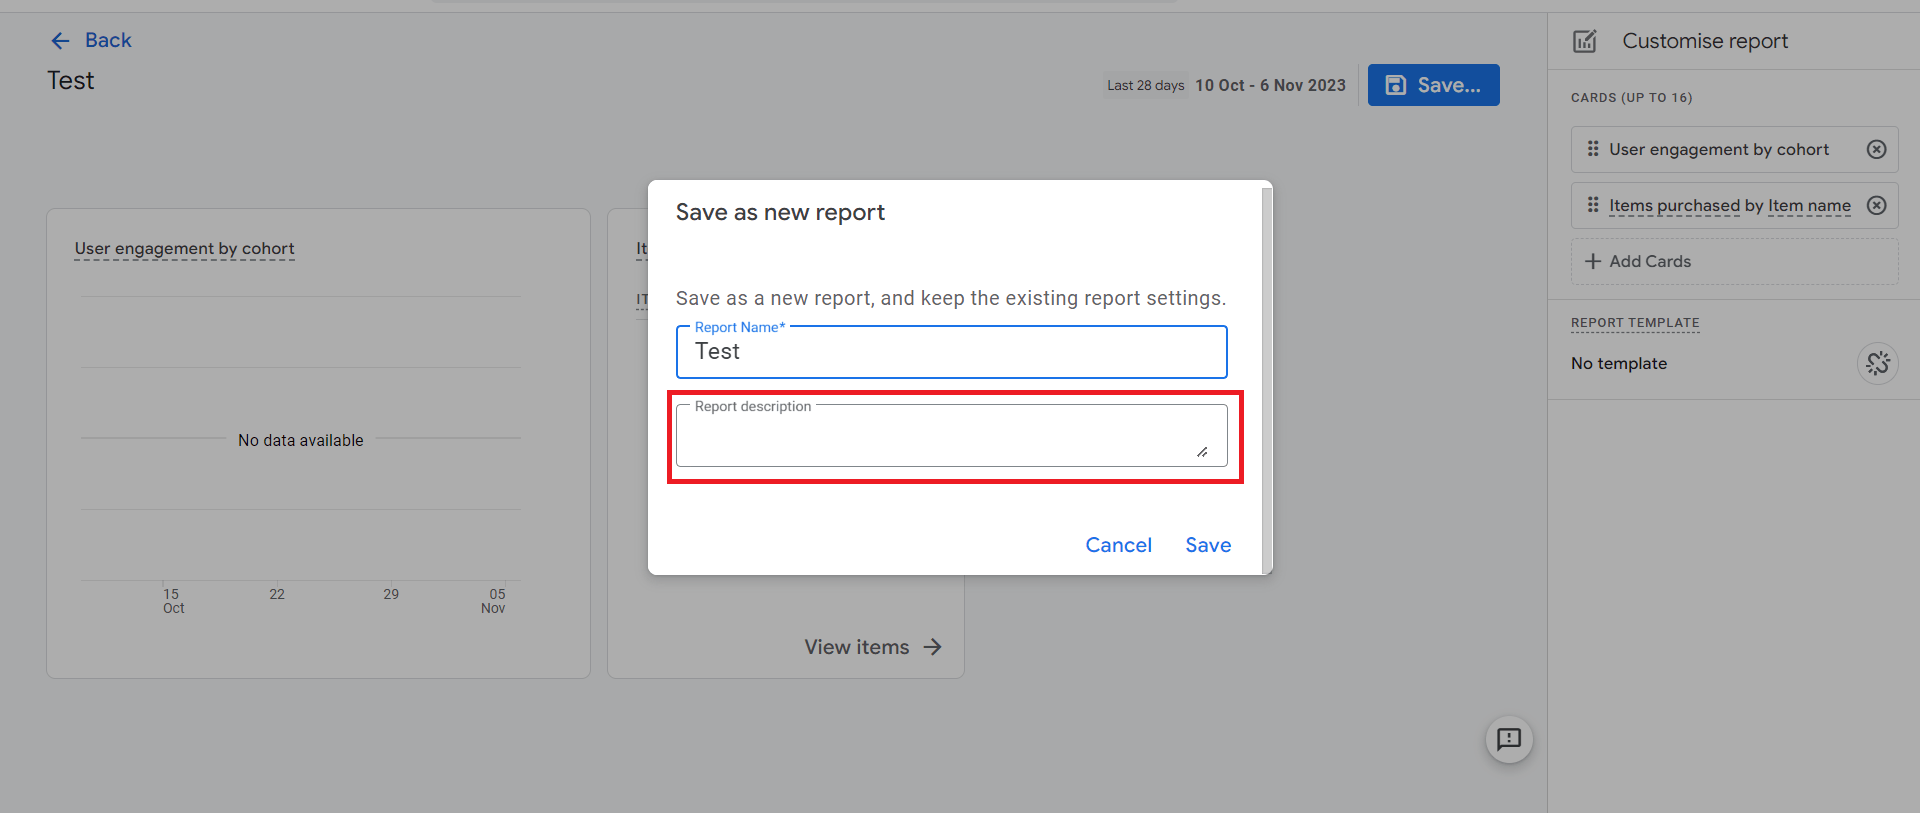
- Customization: Personalize your Overview Report by deciding which summary cards to display. These chosen cards are then visible to all users who have access to that report.
Utilization:
- Click on Create Overview Report
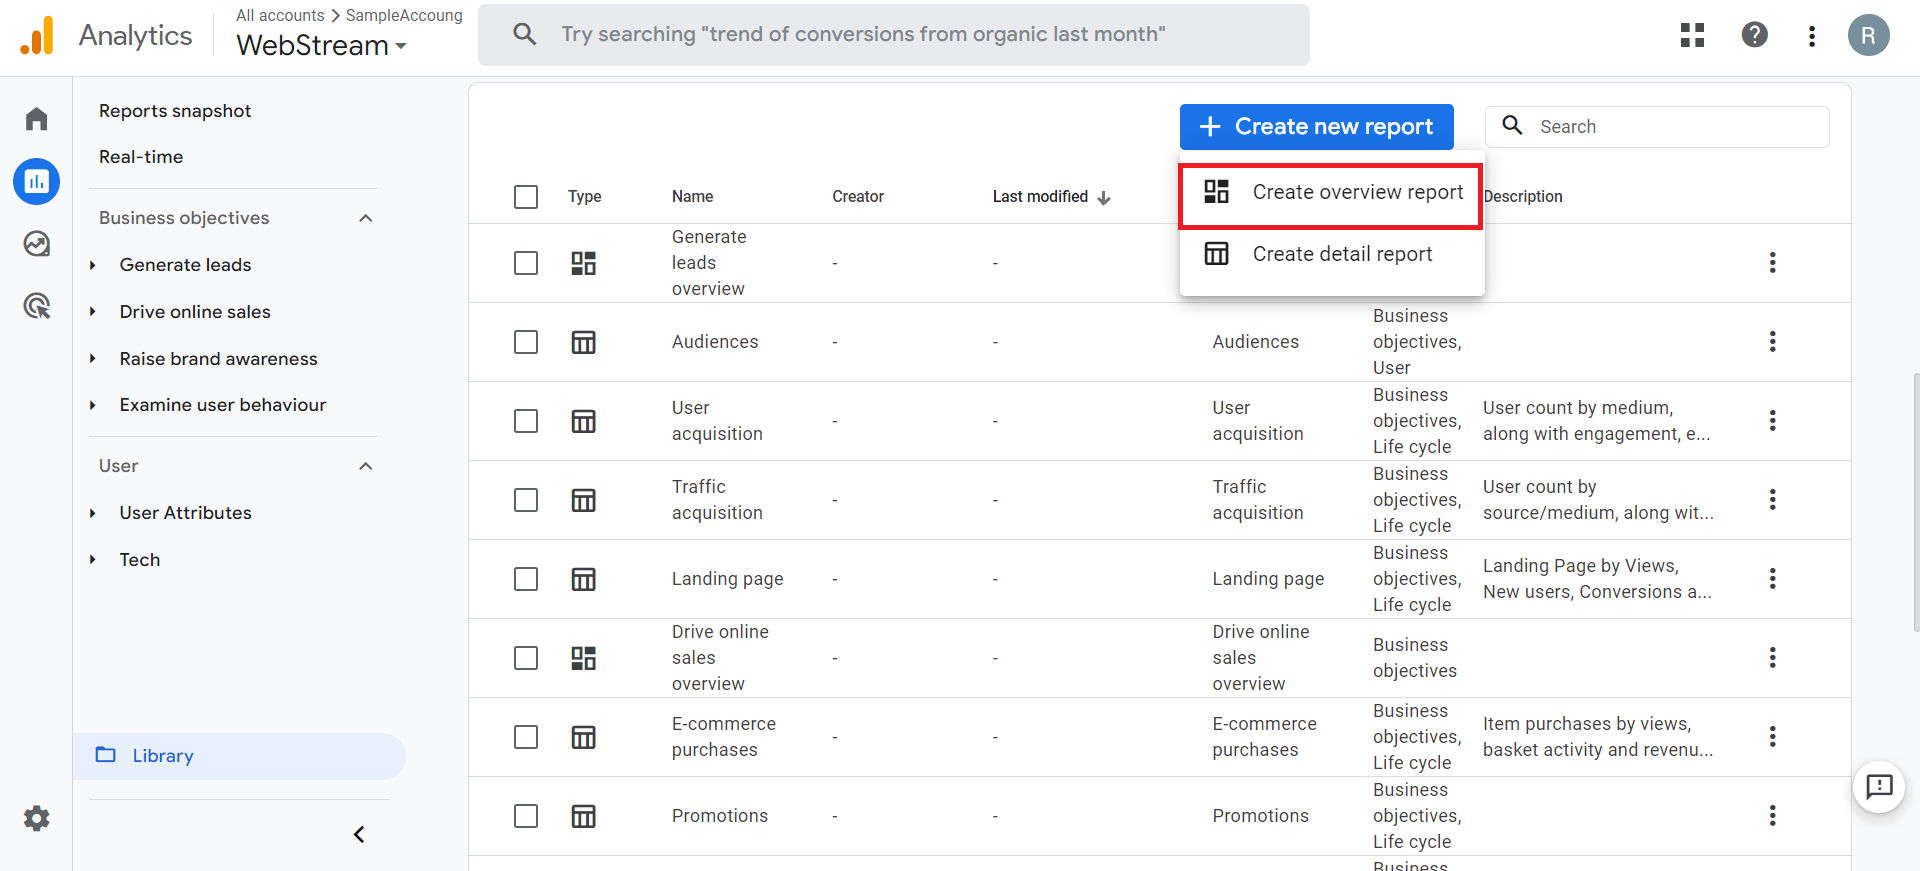
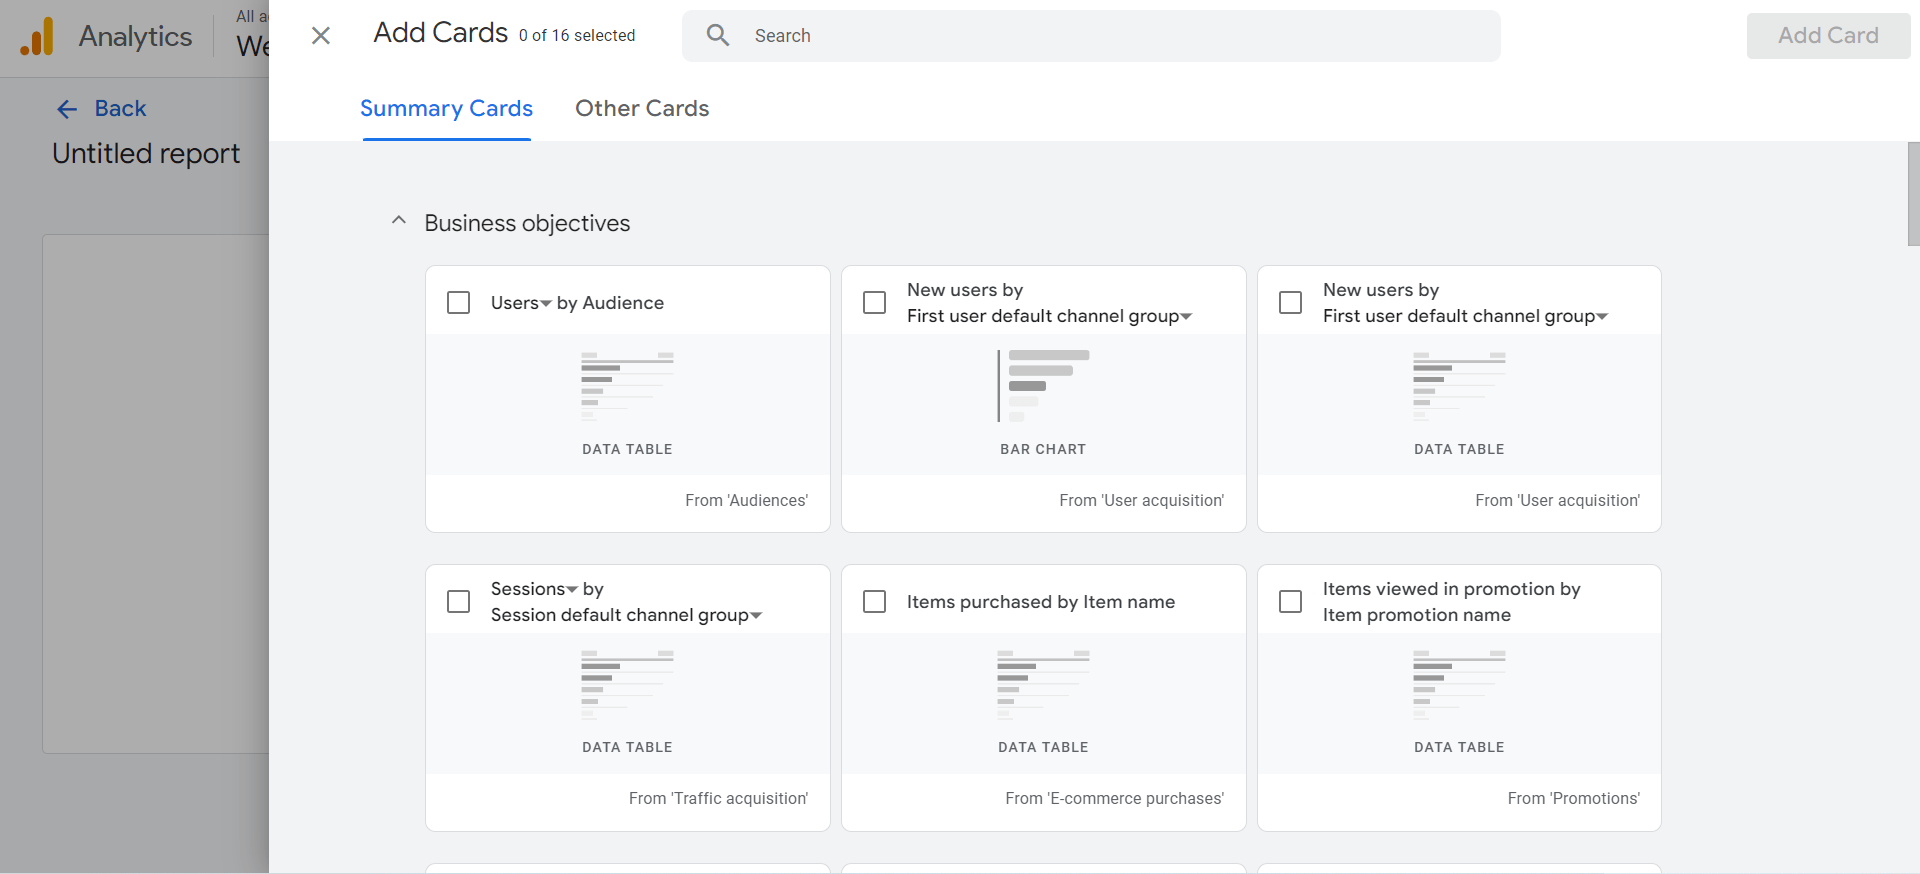
- Click on Add Cards
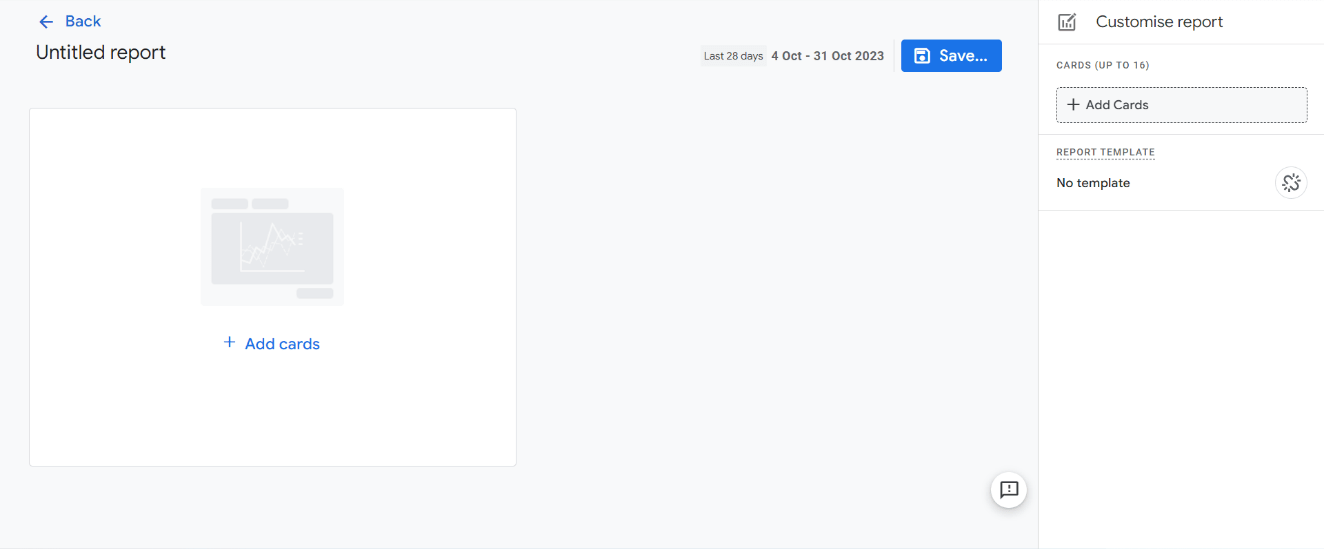
- Select a specific type of card, then save, and then you can add this overview report to a new collection to appear in the GA4 interface.
- Click on Create Overview Report
Detail Reports:
The microscope of GA4’s reporting. They:
- Offer a deeper, granular view of chosen metrics and dimensions.
- Enable side-by-side comparisons, such as contrasting data from two different periods.
- Facilitate in-depth analysis, perfect for a comprehensive understanding of specific metrics.
- components to manage, interpret, and share the data that appears in the report:
- Filters: Zoom into specific segments of your data for detailed analysis. For instance, you might narrow down to data from only specific device users.
- Data Integrity: Determine the comprehensiveness of your report. Assess if certain data is obscured due to factors like data thresholds or platform limits set by Google Analytics.
- Date Selection: Adjust the timeline for your report. You also have the option to juxtapose data from two distinct periods for a comparative study.
- Comparative Analysis: Pit different data subsets against each other for a comparative view.
- Sharing and Download Options: Distribute your report via direct links or download them in formats like PDF or CSV for offline access.
- Data Insights: Harness the power of machine learning and your set parameters to derive actionable insights from your data.
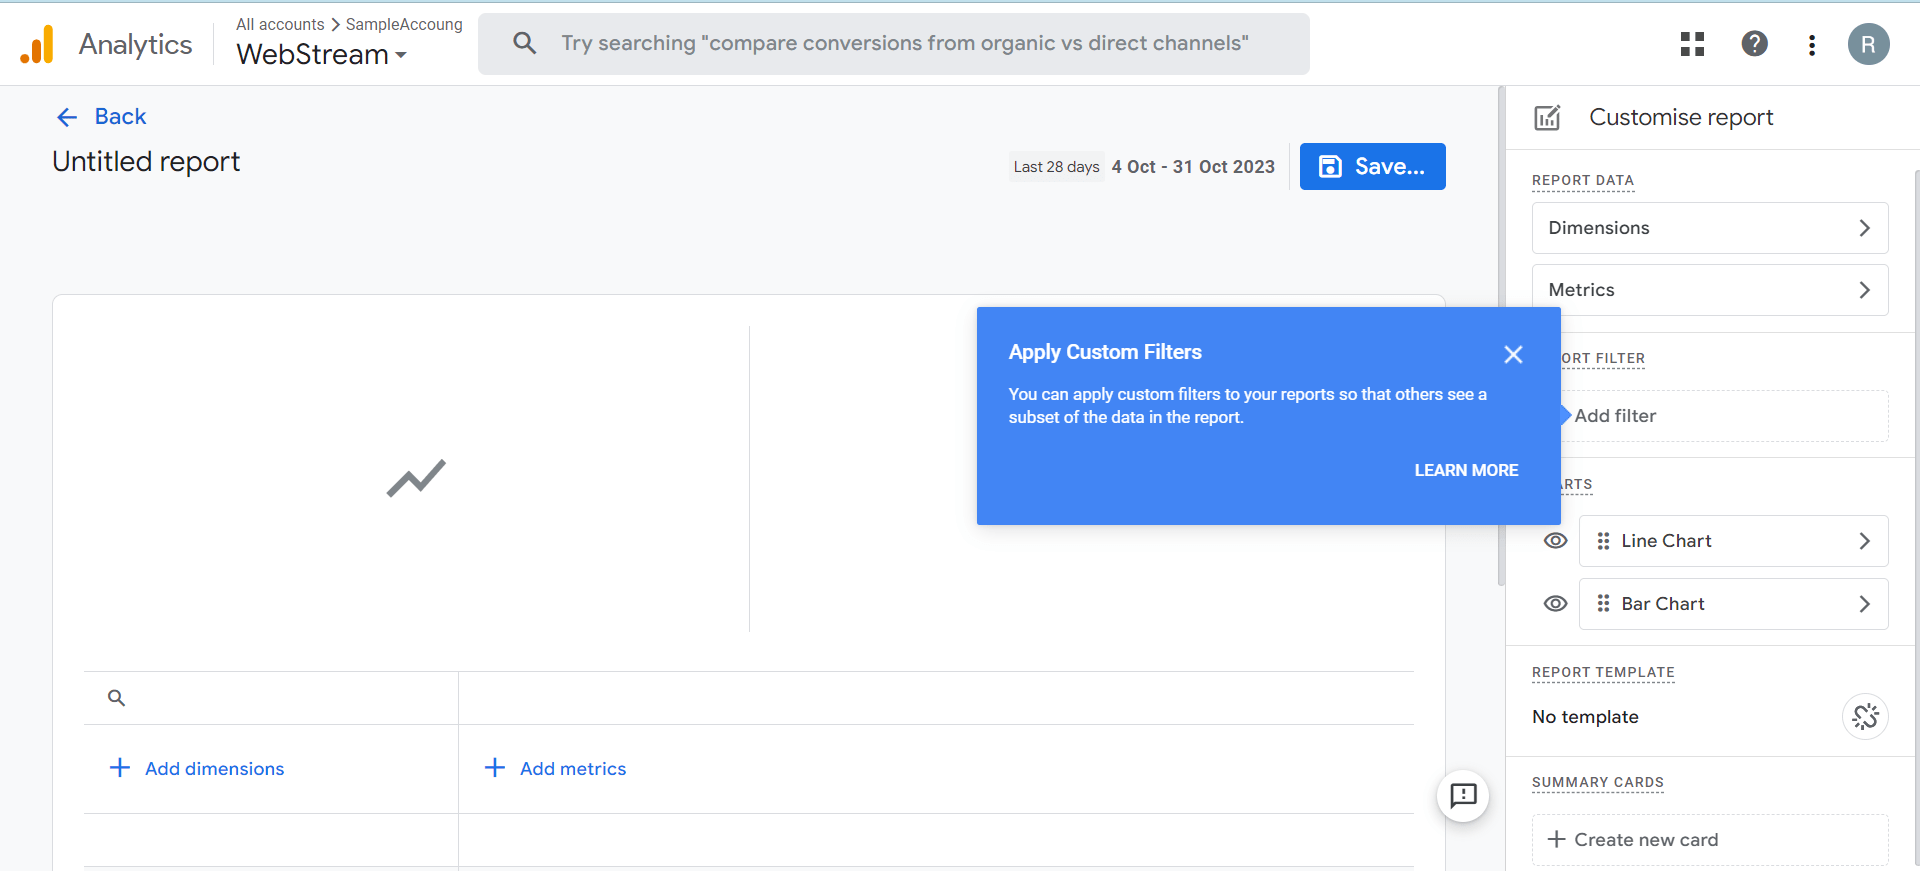
- Personalization: Tailor your report by adjusting the visible dimensions, metrics, and visual representations. Note that only those with editor or administrator privileges have access to this feature.
Utilization:
- Click on Create Detail Report
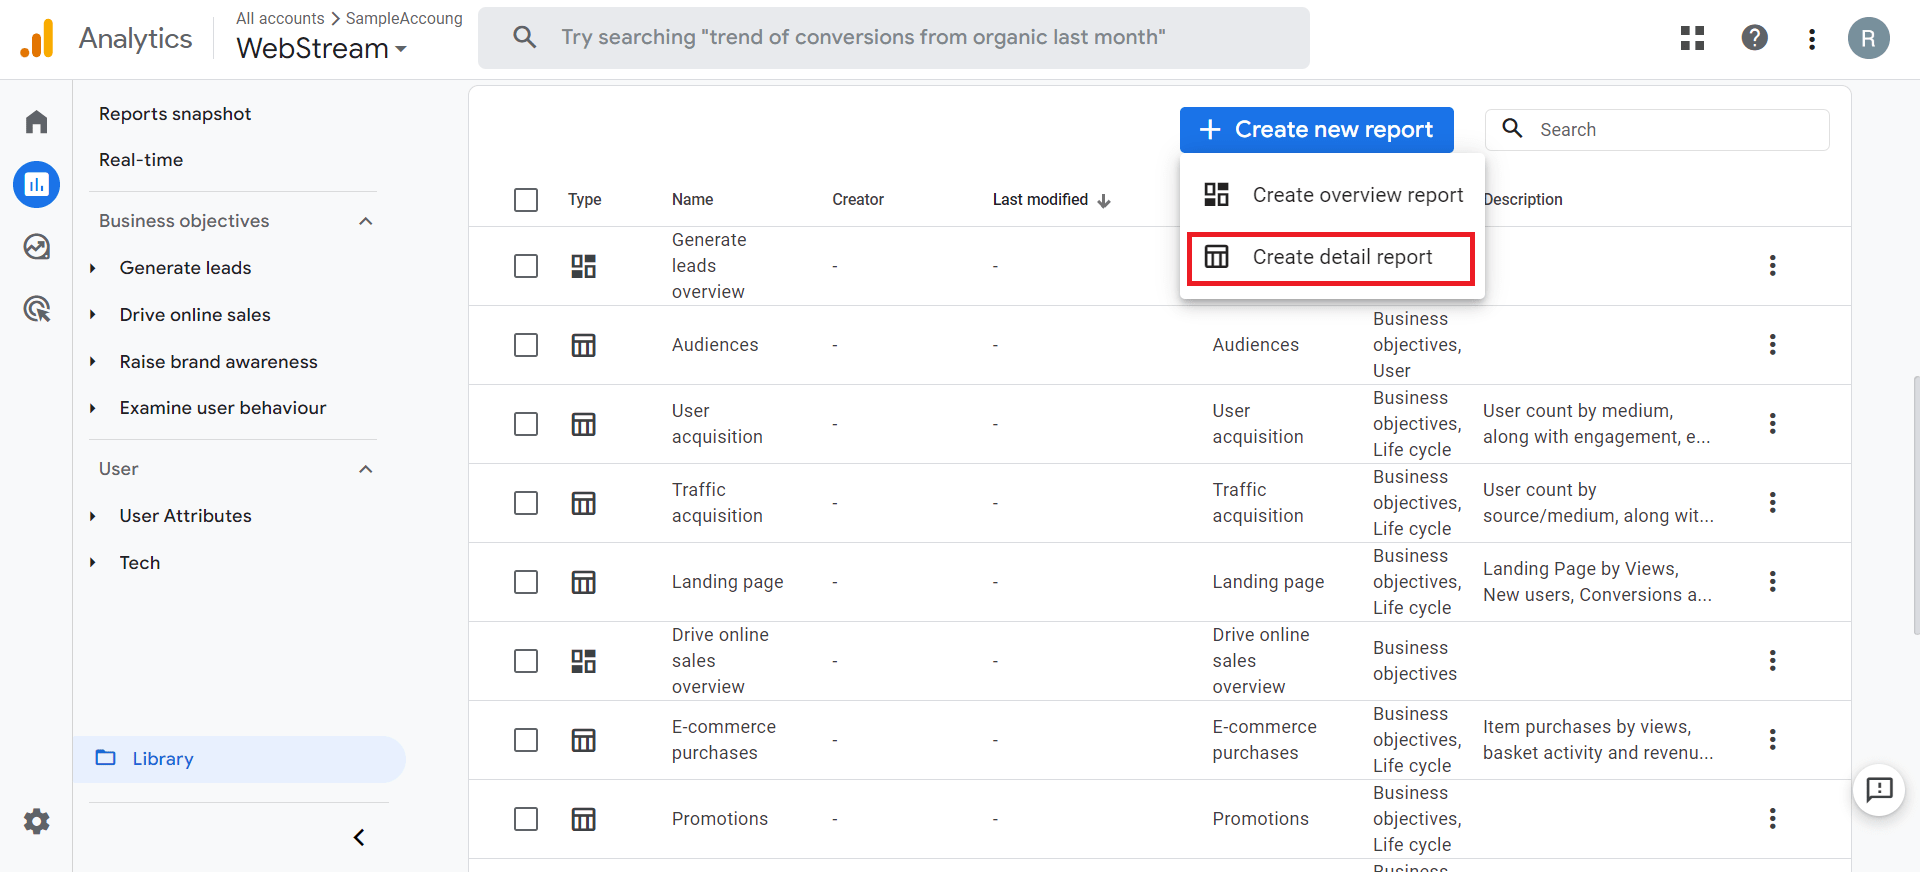
- Choose either a predefined template or a Blank
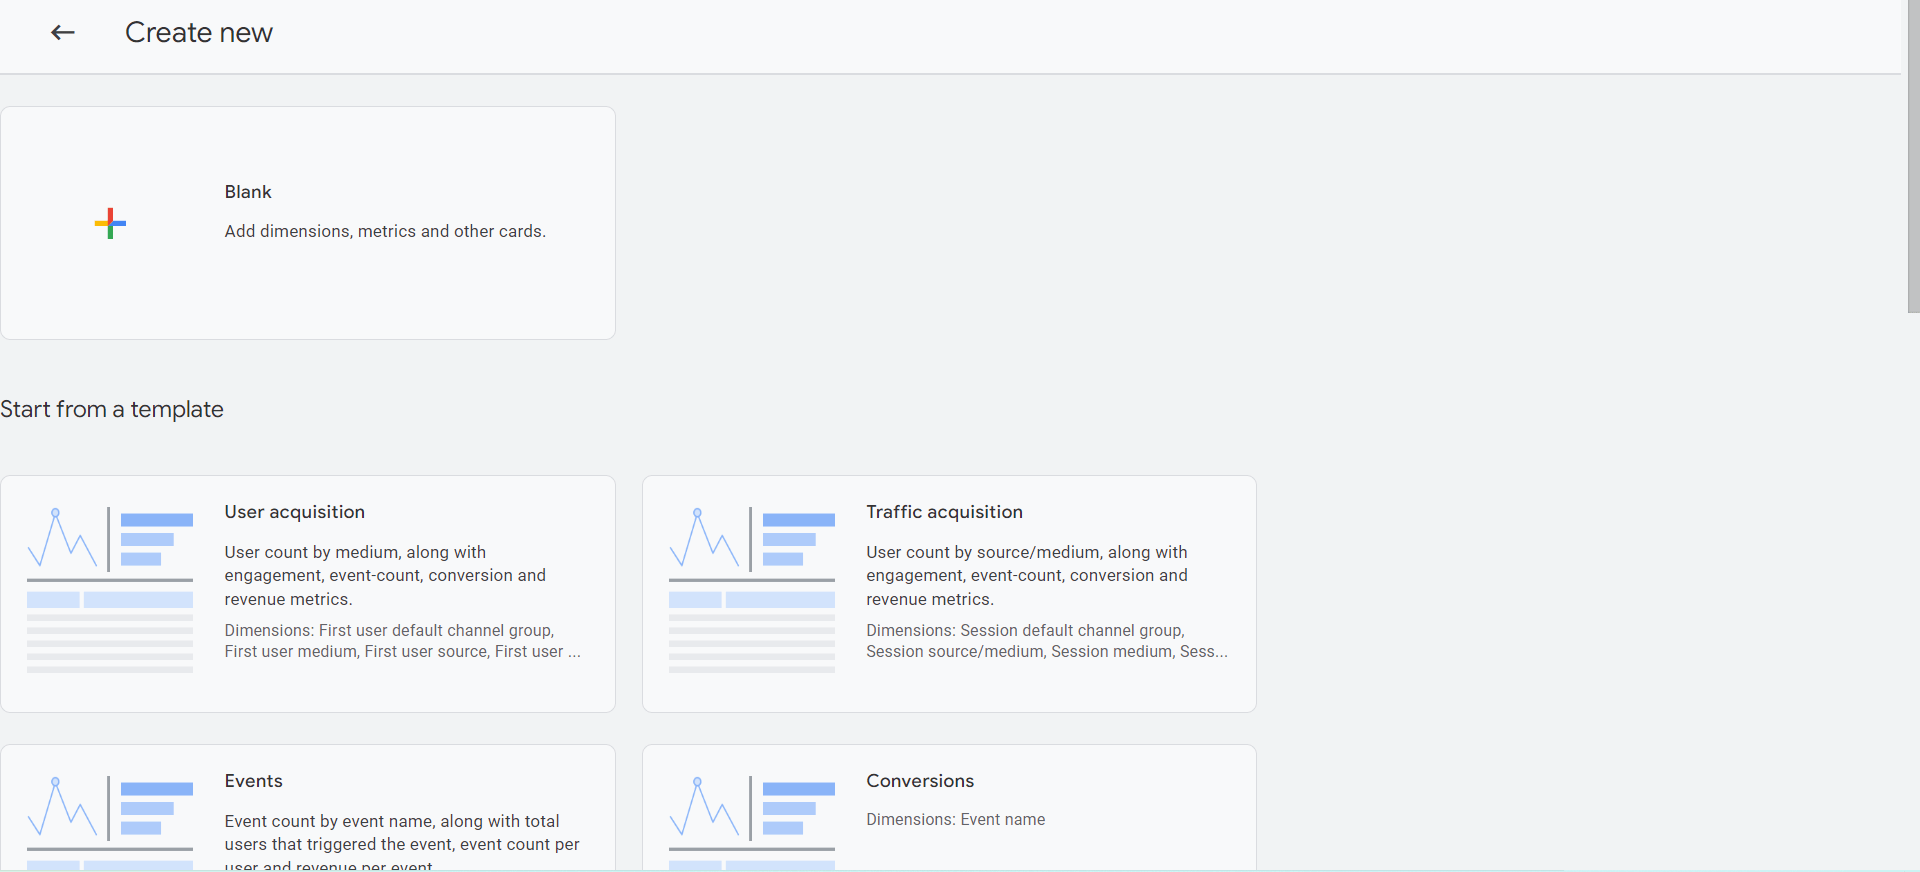
- Create a blank report that includes all of your specifications and business requirements, save it, and then you can add this overview report to a new collection to appear in the GA4 interface.
- Click on Create Detail Report
Collaboration:
- Sharing & Caring: Be it collections or individual reports, share them with your team, promoting a culture of collective analysis and insights.
- Conversations through Comments: Reports aren’t just about numbers. Add comments, ignite discussions, and foster a rich feedback environment.
Pro Tips for Report Library Mastery:
- Initiate Templates: Use templates or pre-existing reports as your springboard. It often saves time and provides direction.
- Routine Audits: Clean the house regularly. Remove outdated or seldom-used reports to keep the library fresh and relevant.
- Accuracy is King: Before sharing, ensure your reports are precise and easily decipherable. Clarity today saves confusion tomorrow.
Conclusion:
The Report Library in GA4, replete with its Collections, Overview Reports, Detail Reports, and more, is a testament to Google’s commitment to offering granular, yet user-friendly analytics.
By empowering businesses with tools to meticulously organize and customize data visualizations, GA4 ensures that insights are not only profound but also readily accessible.
As the digital realm grows, and data becomes the new currency, GA4’s Report Library emerges as an indispensable ally in data-driven decision-making.